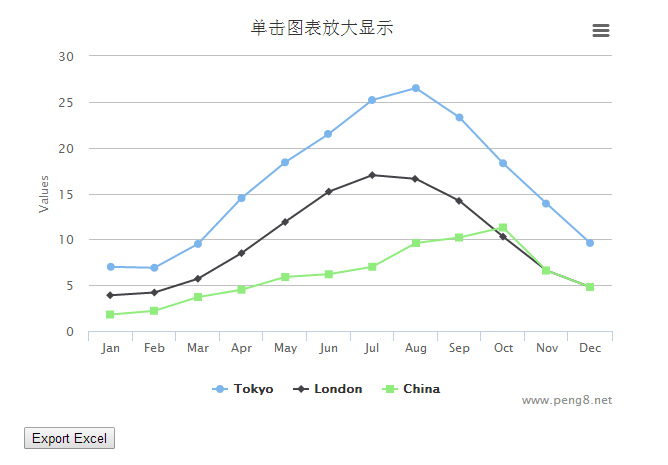
为了照顾小伙伴,用asp.net 写了份highchart简单导出excel的例子,希望对大家有所帮助
- highchart导出 excel,主要用到了内部的
getCSV,将数据post到服务端,至于服务端怎么处理大家就可以可显神通了,我所指知道的一般可以用POI、NPOI、aspose、微软com+组件等等
前端HTML
1 | <div> |
引入相关插件
1 | <script type="text/javascript" src="http://cdn.hcharts.cn/jquery/jquery-1.8.3.min.js"></script> |
前端初始化脚本
1 | <script type="text/javascript"> |

后台导出代码实现
1 | protected void Page_Load(object sender, EventArgs e) |
分析说明:
后端代码写的很粗略,不好的地方,望大家见谅!主要用到 NPOI.dll,自己封装了一个excelHelper.cs 类文件,用来处理 DataTable数据集 一键插入到excel里。
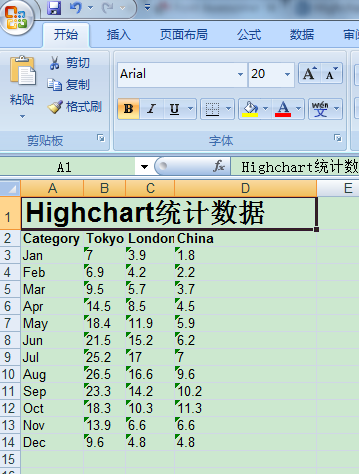
- 最后来张导出的效果图

DEMO下载 :点击此处下载